
Monitoring consists of observing metrics of your application that will allow you to know its health condition.
There are different observable metrics:
- resources consumption (CPU, memory, IO, …)
- network traffic
- business metrics (endpoint response time, requests errors, …)
This post will be dedicated to setting up monitoring on a Node.JS application written in Typescript.
We will set up the business metrics exposure in our application and then we will exploit them with Prometheus and Grafana.
Requirements
You will need an existing Node.JS API project.
If you don’t have an existing project, you can follow the next steps with my demo project.
Go to this URL https://gitlab.com/ziggornif/monitoring-article/-/tree/before
Then download the project and install it locally.
cd <project>
npm install
To quickly create the needed grafana and prometheus instances, I will use Docker all along this article
API prometheus metrics
Configuration
First, install the Node.JS Prometheus dependency.
npm add prom-client
Then, import the dependency in your application.
import promClient from 'prom-client';
And create a registry container.
const register = new promClient.Registry();
register.setDefaultLabels({
  app: 'monitoring-article',
});
Add the /metrics endpoint (i use ExpressJS in this example).
app.get('/metrics', async (req: Request, res: Response) => {
  res.setHeader('Content-Type', register.contentType);
  res.send(await register.metrics());
});
We have now a fully configured prometheus client to export our application metrics. Let’s collect some data !
Collect API metrics
We will now collect the API endpoints response time and collect :
- http code
- method (GET, POST, …)
- route URI
Responses time will be stored in milliseconds.
To do that, we need to create an histogram.
const httpRequestTimer = new promClient.Histogram({
  name: 'http_request_duration_ms',
  help: 'Duration of HTTP requests in ms',
  labelNames: ['method', 'route', 'code'],
  // buckets for response time from 0.1ms to 1s
  buckets: [0.1, 5, 15, 50, 100, 200, 300, 400, 500, 1000],
});
Then, use the created historgram on each API endpoint to store the response times.
app.get('/tweets', async (req: Request, res: Response) => {
  const start = Date.now();
  try {
    ...
  } finally {
    const responseTimeInMs = Date.now() - start;
    httpRequestTimer.labels(req.method, req.route.path, res.statusCode.toString()).observe(responseTimeInMs);
  }
});
Now, the endpoint response time will be stored on the prometheus histogram on each call.
Setup Prometheus
Create a prometheus.yml file with the following content to declare the metrics scraper.
global:
  scrape_interval: 5s
scrape_configs:
  - job_name: "monitoring-article"
    static_configs:
      - targets: ["localhost:8080"]
Target configuration for each OS with docker :
- Linux:
- targets: ["localhost:8080"] - Mac:
- targets: ["docker.for.mac.host.internal:8080"] - Windows:
- targets: ["docker.for.win.localhost:8080"]
Setup Grafana
Create a datasource.yml file with the following content to set the prometheus datasource.
apiVersion: 1

datasources:
  - name: Prometheus
    type: prometheus
    access: proxy
    orgId: 1
    url: http://localhost:9090
    basicAuth: false
    isDefault: true
    editable: true
URL configuration for each OS with docker :
- Linux:
url: http://localhost:9090 - Mac:
url: http://docker.for.mac.host.internal:9090 - Windows:
url: http://docker.for.win.localhost:9090
Run services
For this demonstration, i will use a docker-compose file to declare my prometheus and grafana instances.
The previously created files have been created in the
monitoringfolder.
version: "3.3"
services:
  prometheus:
    image: prom/prometheus:latest
    volumes:
      - ./monitoring/:/etc/prometheus/
    ports:
      - 9090:9090
  grafana:
    image: grafana/grafana:latest
    volumes:
      - ./monitoring/datasources.yml:/etc/grafana/provisioning/datasources/datasources.yml
    ports:
      - 3000:3000
    environment:
      - GF_AUTH_DISABLE_LOGIN_FORM=true
      - GF_AUTH_ANONYMOUS_ENABLED=true
      - GF_AUTH_ANONYMOUS_ORG_ROLE=Admin
⚠️ this is a demo config only, do not use this in production
Then run the containers.
docker-compose up -d
We now have a prometheus and a grafana which are running in containers.
Create API Dashboard
💡 If you want to skip the dashboard creation, you can import it from the project sources (the bonus section explains how to import a dashboard).
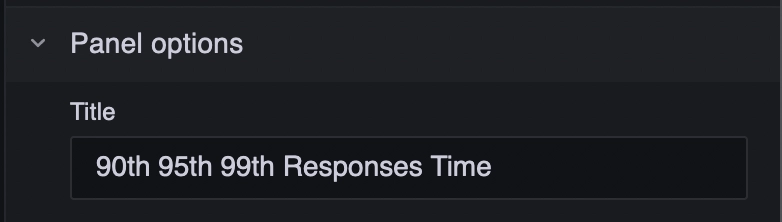
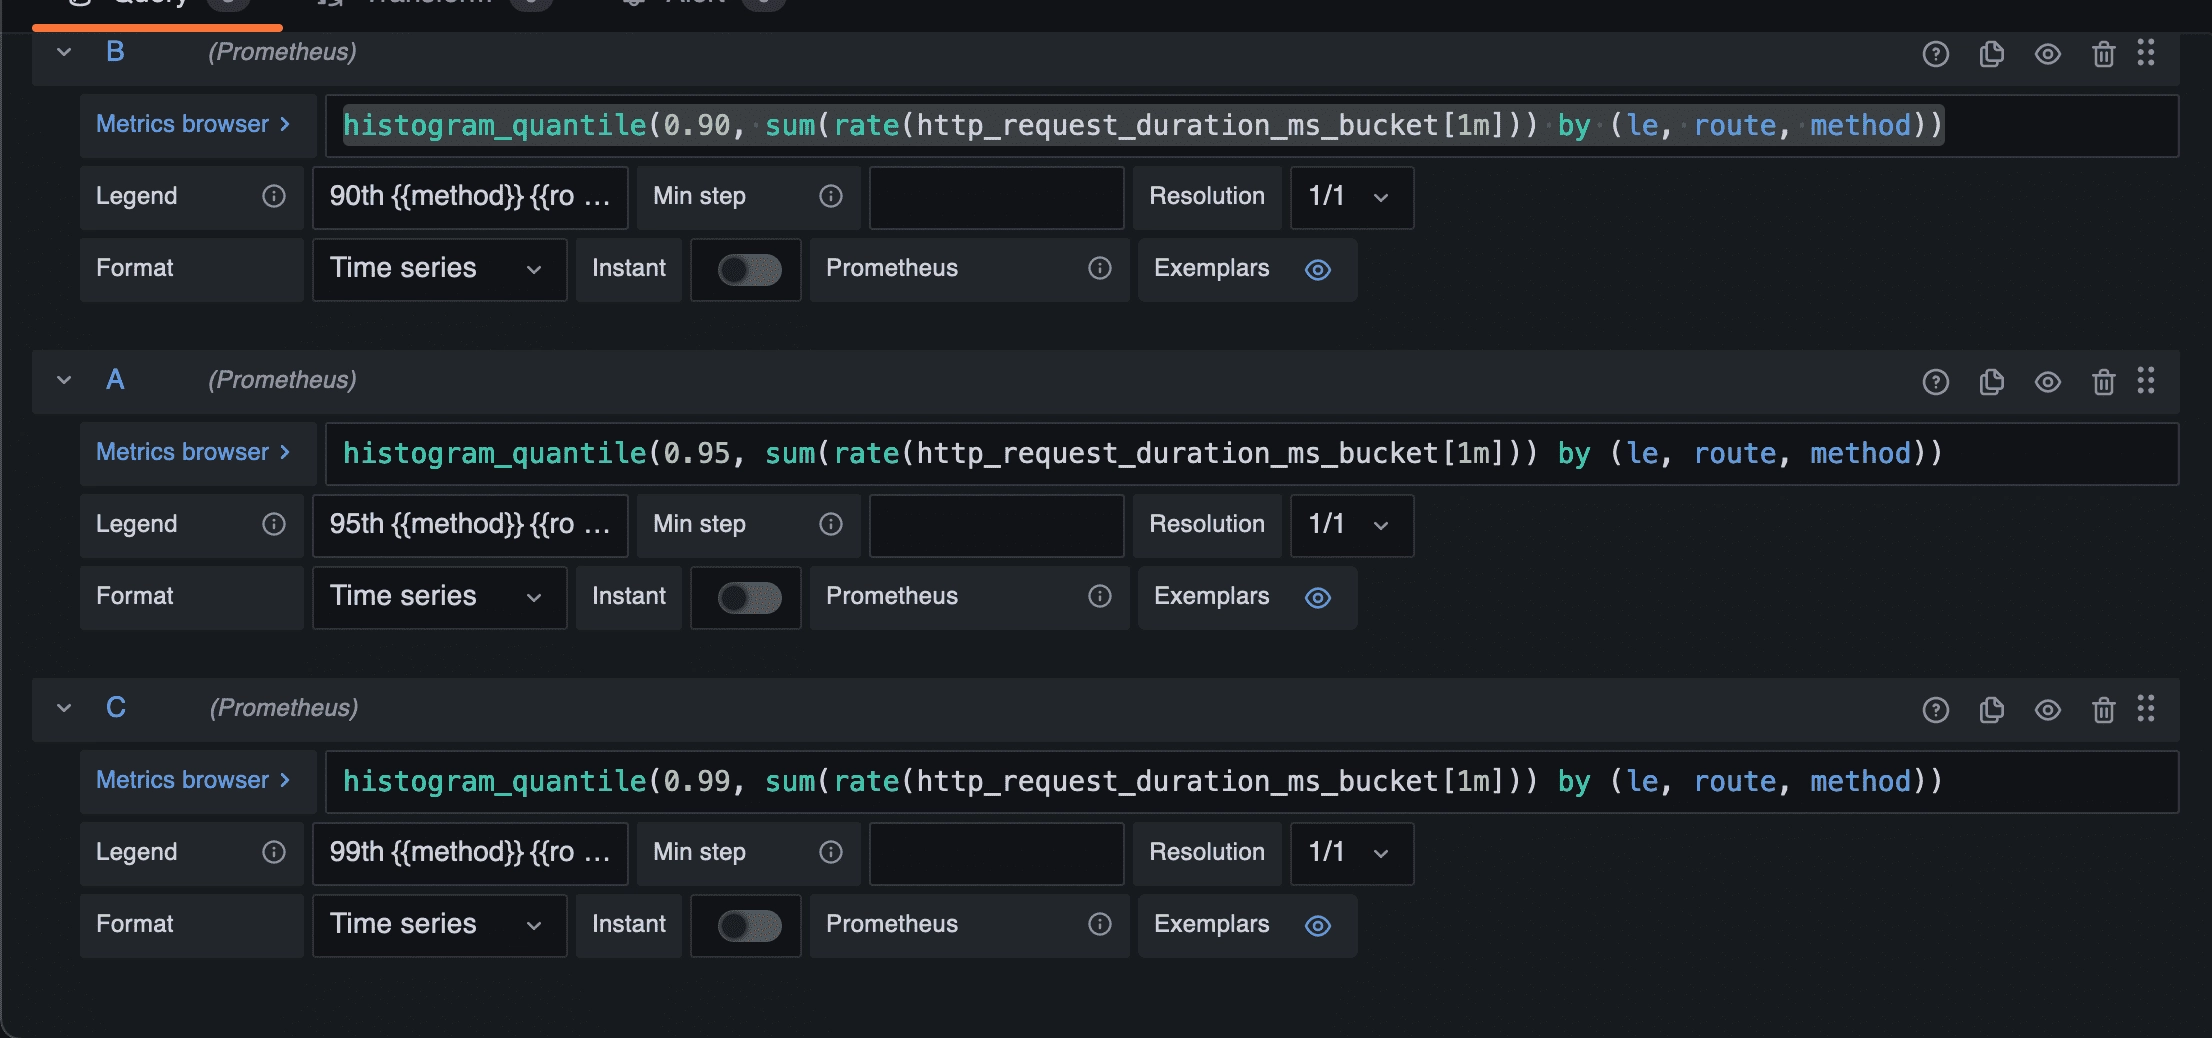
90th 95th 99th responses time panel
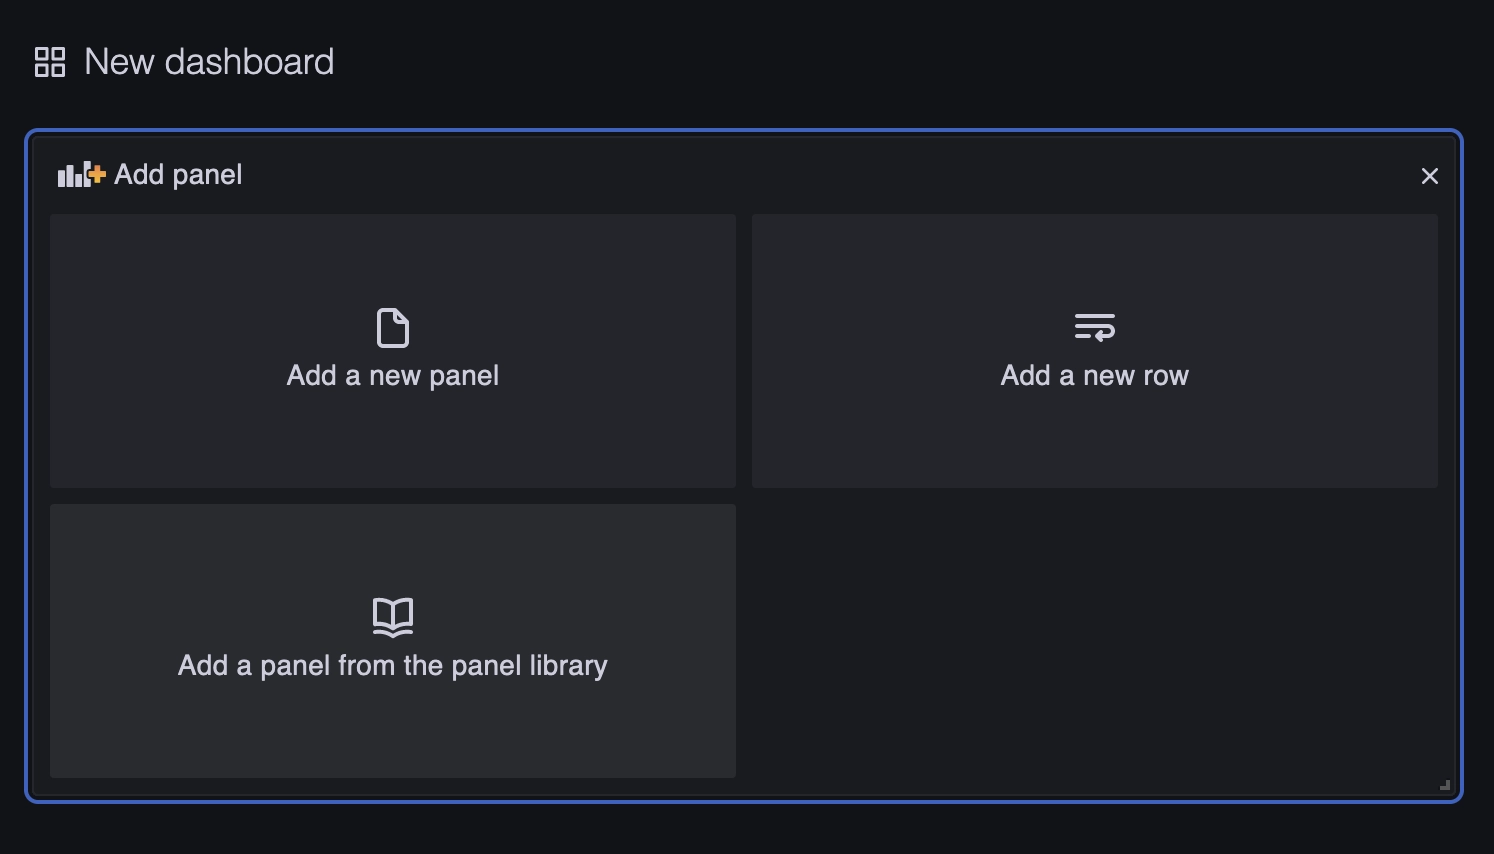
Let’s create the first panel.
Click on the “Add a new panel” button.
Keep the default time series visualization.
Set the panel title on the right side bar.
On the Metrics browser field add the following query to create the 90th percentile response time :
histogram_quantile(0.90, sum(rate(http_request_duration_ms_bucket[1m])) by (le, route, method))
And add on the Legend field :
90th {{method}} {{route}}
Repeat the same operation for the 95th and 99th percentiles.
To do this, click on the “+ Query” button to add metrics.
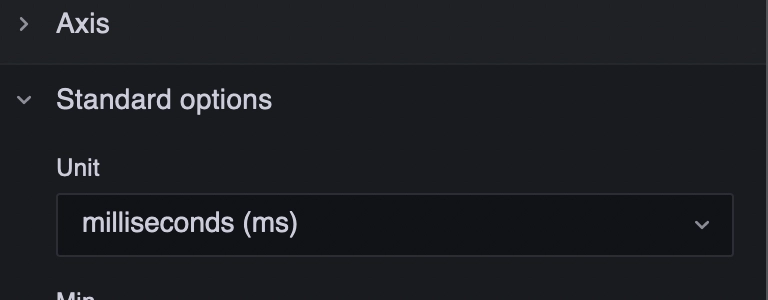
To finish the configuration, set the Y axis unit to milliseconds in the right side bar (Time > milliseconds).
Then, click on the Apply button.

Repeat the same actions for the next panels.
Average response time
Create a new panel.
Keep the default time series visualization.
On the right side bar, set the panel title and the Y axis unit to milliseconds.
And the following query on the Metrics browser field.
avg(rate(http_request_duration_ms_sum[$__range]) / rate(http_request_duration_ms_count[$__range])) by (route, method)
💡
$__rangeis a Prometheus supported variable that represent the current dashboard range
And on the Legend field :
{{method}} {{route}}
Requests details
Create a new panel.
Keep the default time series visualization.
On the right side bar, set the panel title and don’t touch to the Y axis unit.
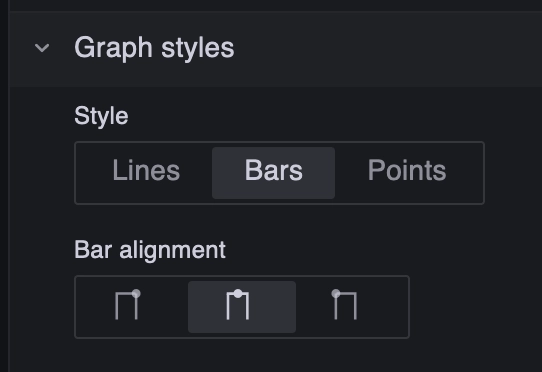
Always on the side bar, go to Graph styles section and set style to Bars.
Create three metrics fields which will collect 2xx, 4xx and 5xx requests.
Metrics field :
sum(increase(http_request_duration_ms_count{code=~"2.*"}[1m])) by (route, method)
Label : 2xx {{method}} {{route}}
Metrics field :
sum(increase(http_request_duration_ms_count{code=~"4.*"}[1m])) by (route, method)
Label : 4xx {{method}} {{route}}
sum(increase(http_request_duration_ms_count{code=~"5.*"}[1m])) by (route, method)
Label : 5xx {{method}} {{route}}
Number of requests per minute
Create a new panel.
Keep the default time series visualization.
On the right side bar, set the panel title and don’t touch to the Y axis unit.
And the following query on the Metrics browser field.
Metrics field :
sum(increase(http_request_duration_ms_count[1m]))
Label : Requests
Number of failed requests
Create a new panel.
Keep the default time series visualization.
On the right side bar, set the panel title and the graph style to Bars.
Create two metrics fields which will collect 4xx and 5xx requests.
Metrics field :
sum(increase(http_request_duration_ms_count{code=~"4.*"}[1m]))
Label : 4xx errors
Metrics field :
sum(increase(http_request_duration_ms_count{code=~"5.*"}[1m]))
Label : 5xx errors
Number of 200 OK vs Errors
Create a new panel.
Keep the default time series visualization.
On the right side bar, set the panel title and the graph style to Bars.
Create two metrics fields which will collect 200 and error requests.
Metrics field :
sum(increase(http_request_duration_ms_count{code=~"2.*"}[1m]))
code =~"2.*"will collect all results with a 2xx code
Label : Valid requests
Metrics field :
sum(increase(http_request_duration_ms_count{code!~"2.*"}[1m]))
code =~"2.*"will collect all results with a code other than 2xx
Label : Error requests
Load metrics
I have use a Postman Runner to generate some trafic on the application.
The scenario create resources with the POST Endpoint and get resources with the GET Endpoint.
The application endpoints also have a slowdown and error randomizer to test each dashboard panel.
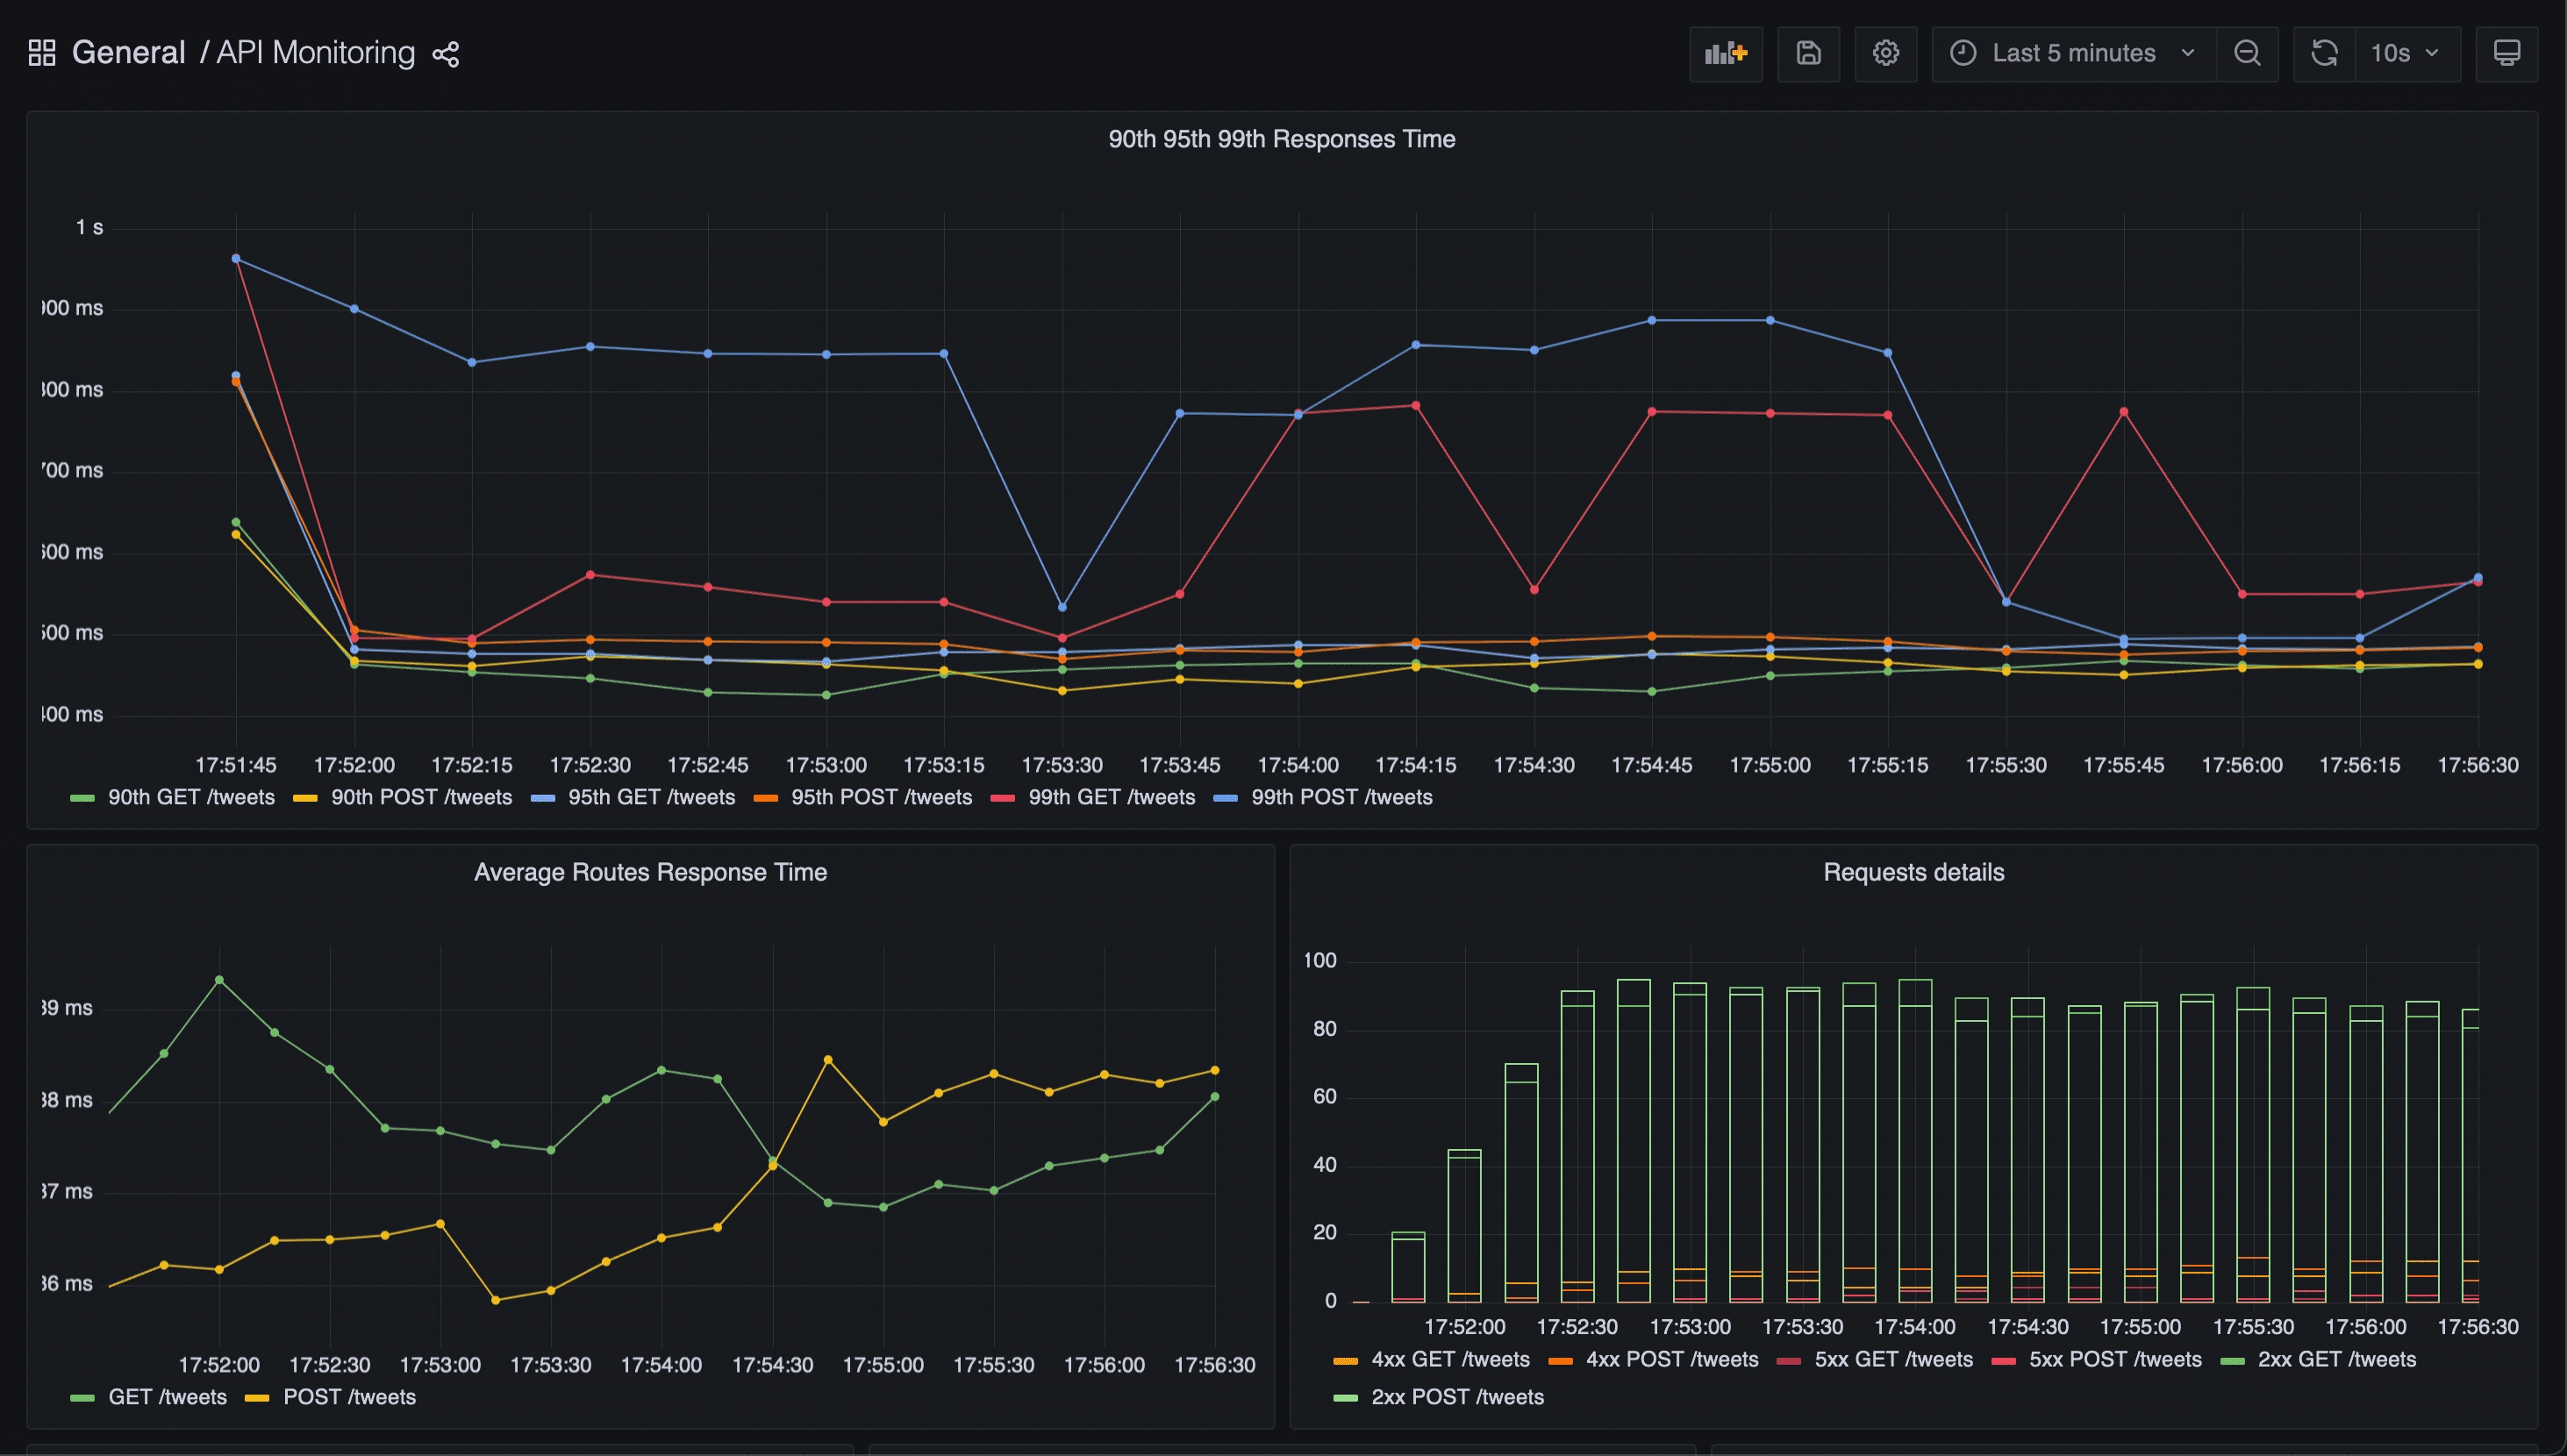
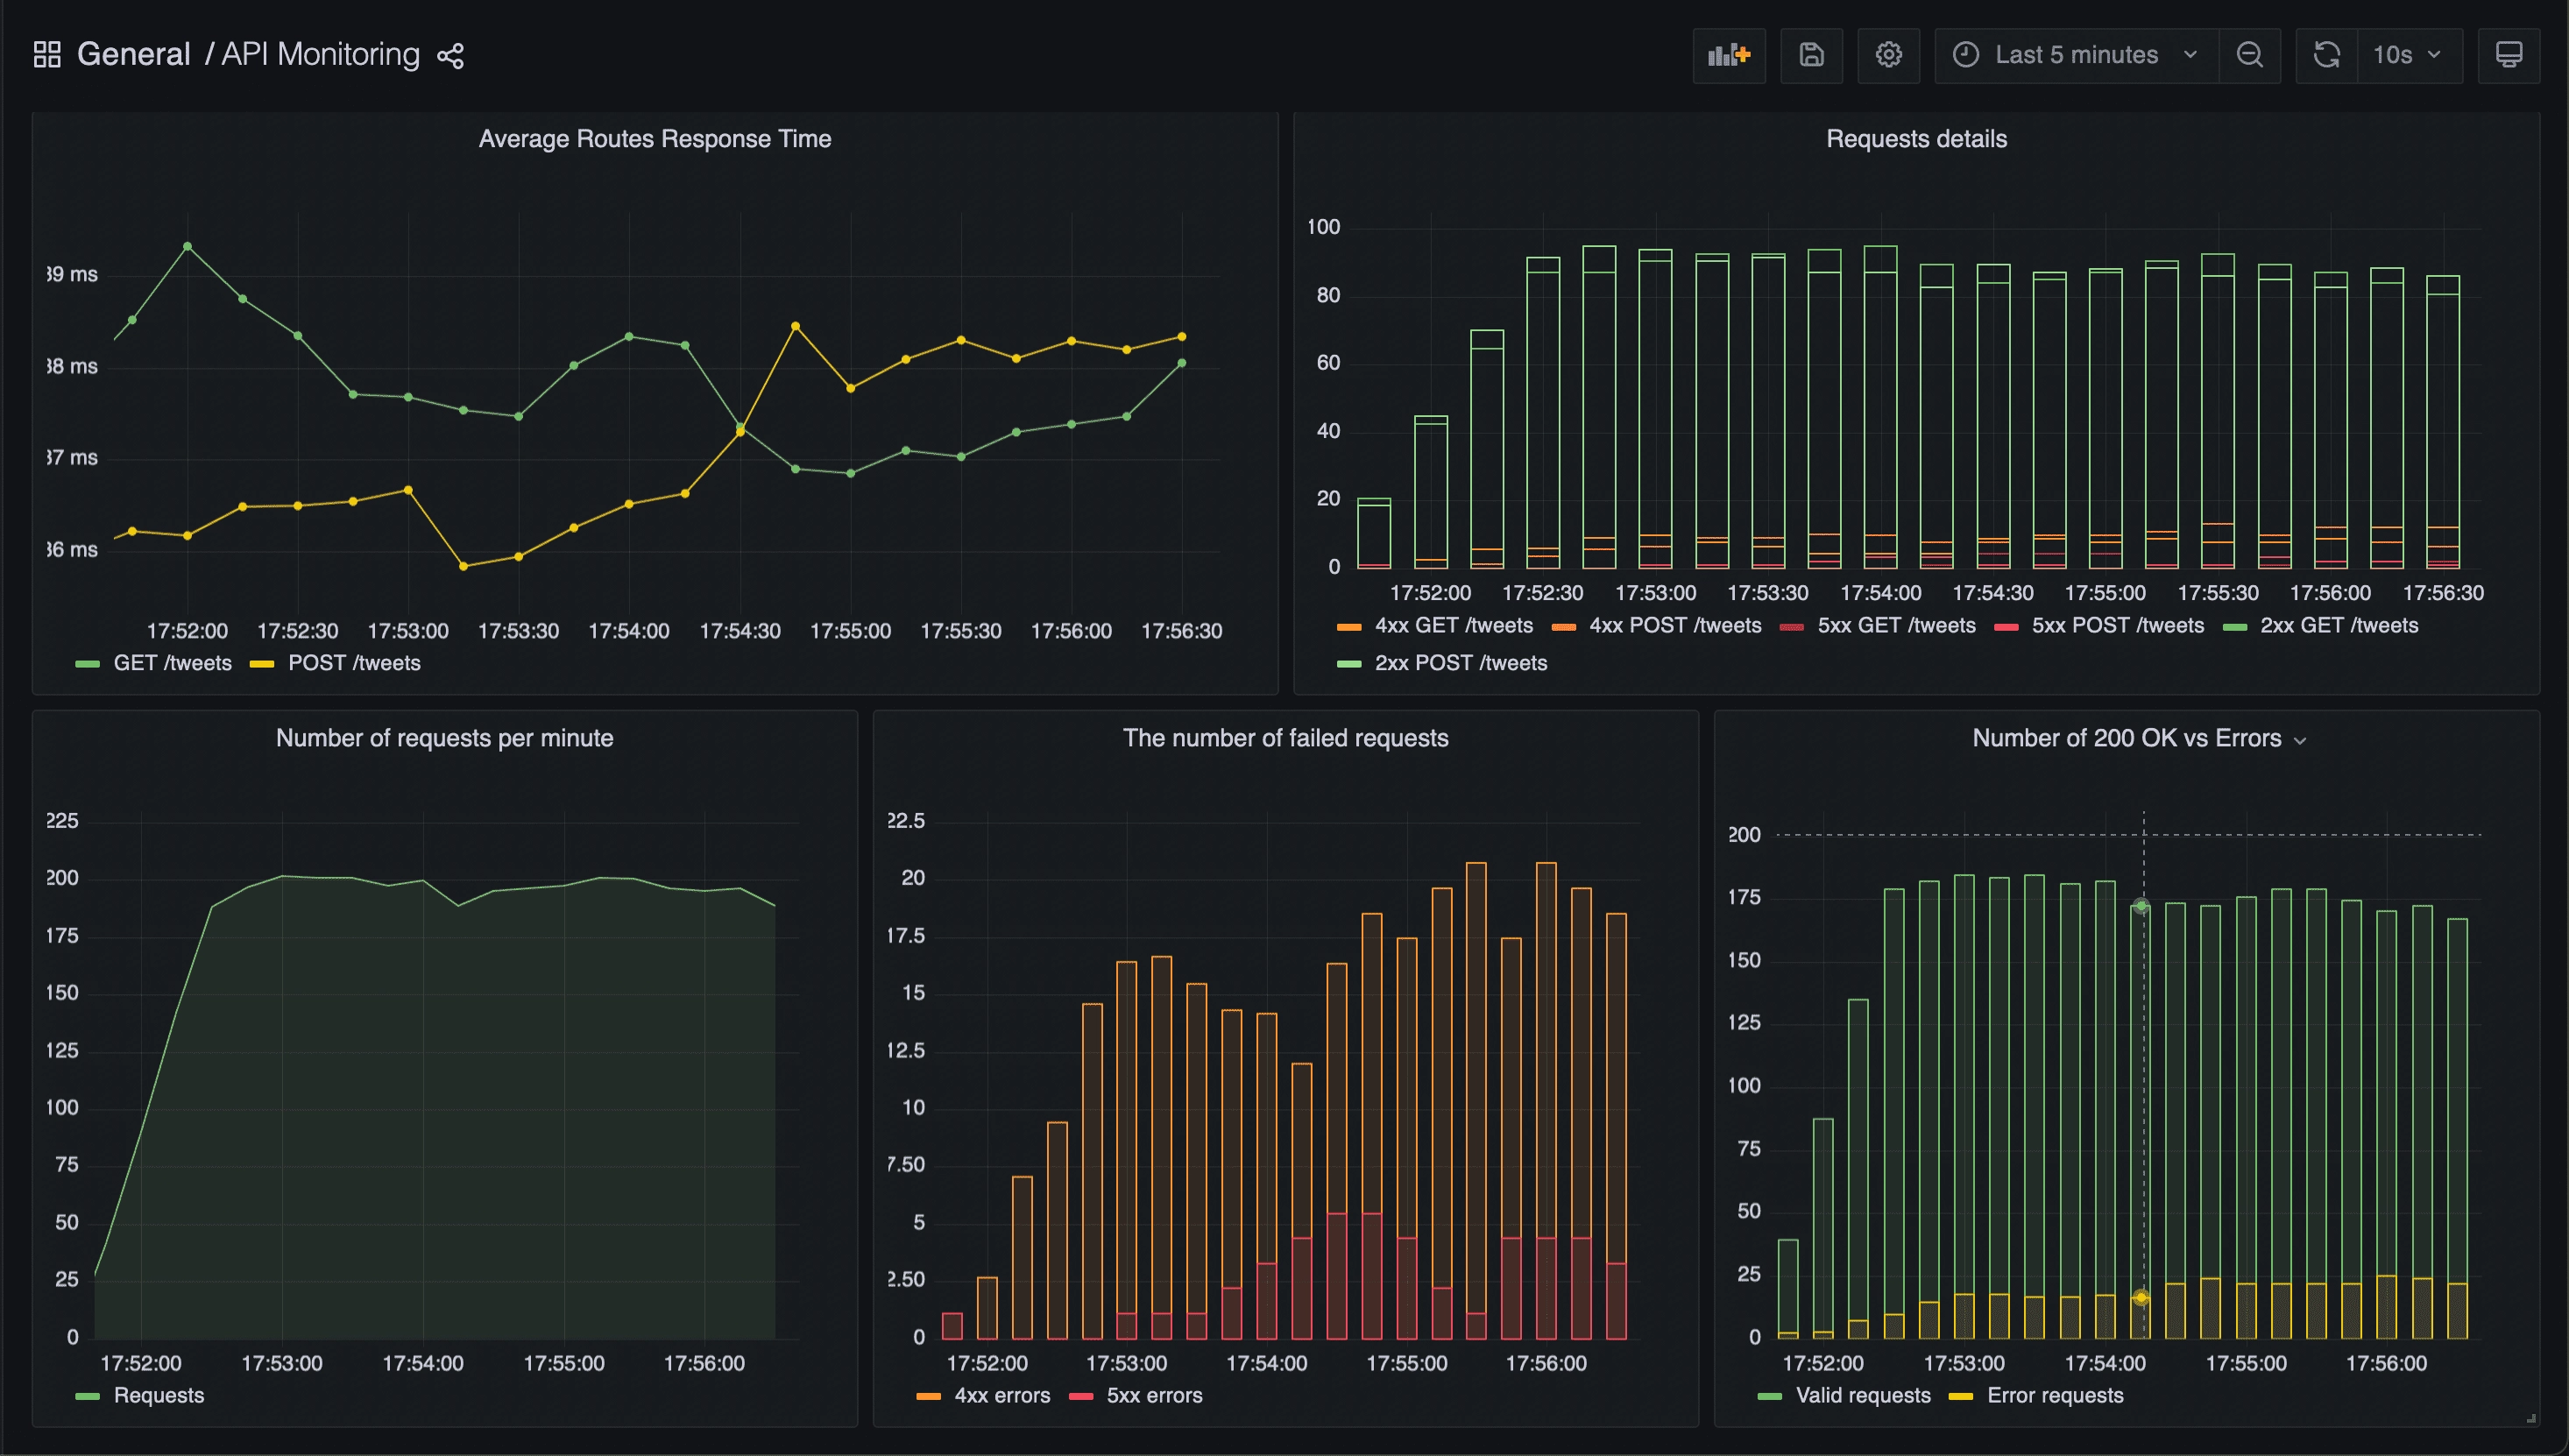
Results
Here some screenshots of the API dashboard results.
Conclusion
Thanks to this dashboard, we can now monitor the following metrics:
- The 90th 95th and 99th percentiles of the application endpoints
- The average response time of the endpoints
- The requests details (number of 2xx, 4xx, 5xx)
- The number of requests per minute
- Comparison of the number of OK requests with the number of KO requests
Bonus : monitoring Node.JS metrics
Add prometheus default metrics
Add the following line to enable Node.JS default metrics collection.
promClient.collectDefaultMetrics({ register });
NodeJS Application Dashboard
Go to the Grafana website to retrieve the Node.JS Application Dashboard
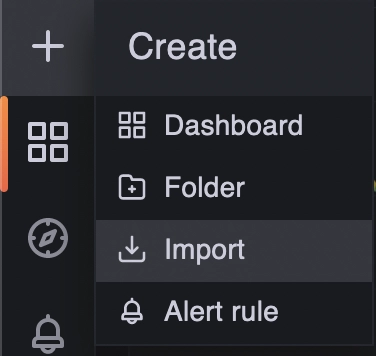
Then import it :
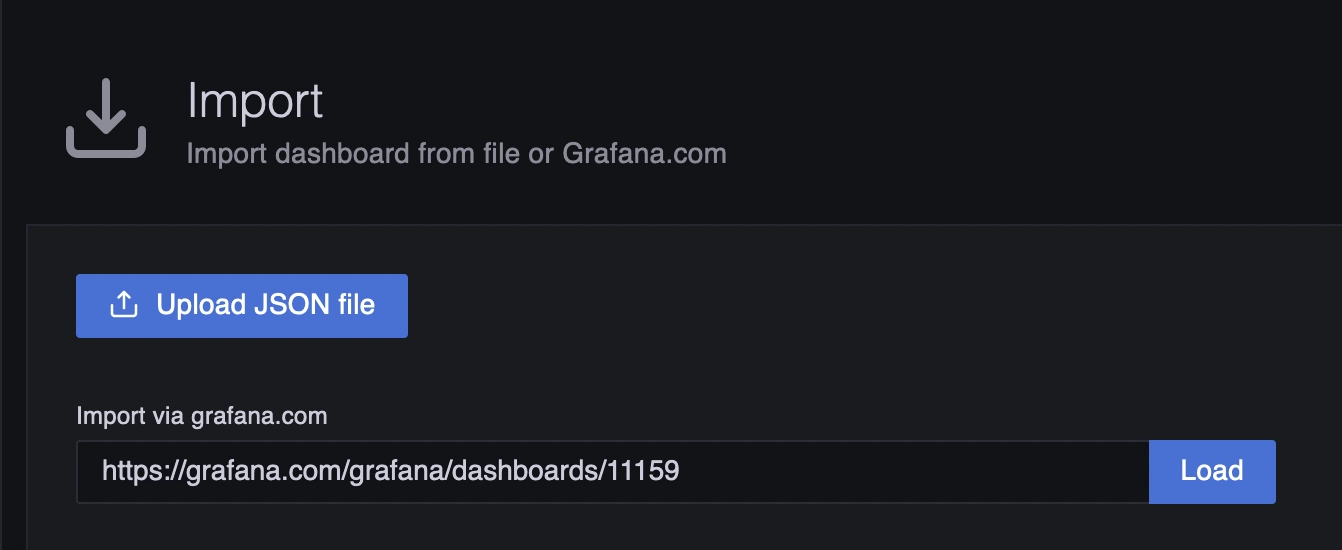
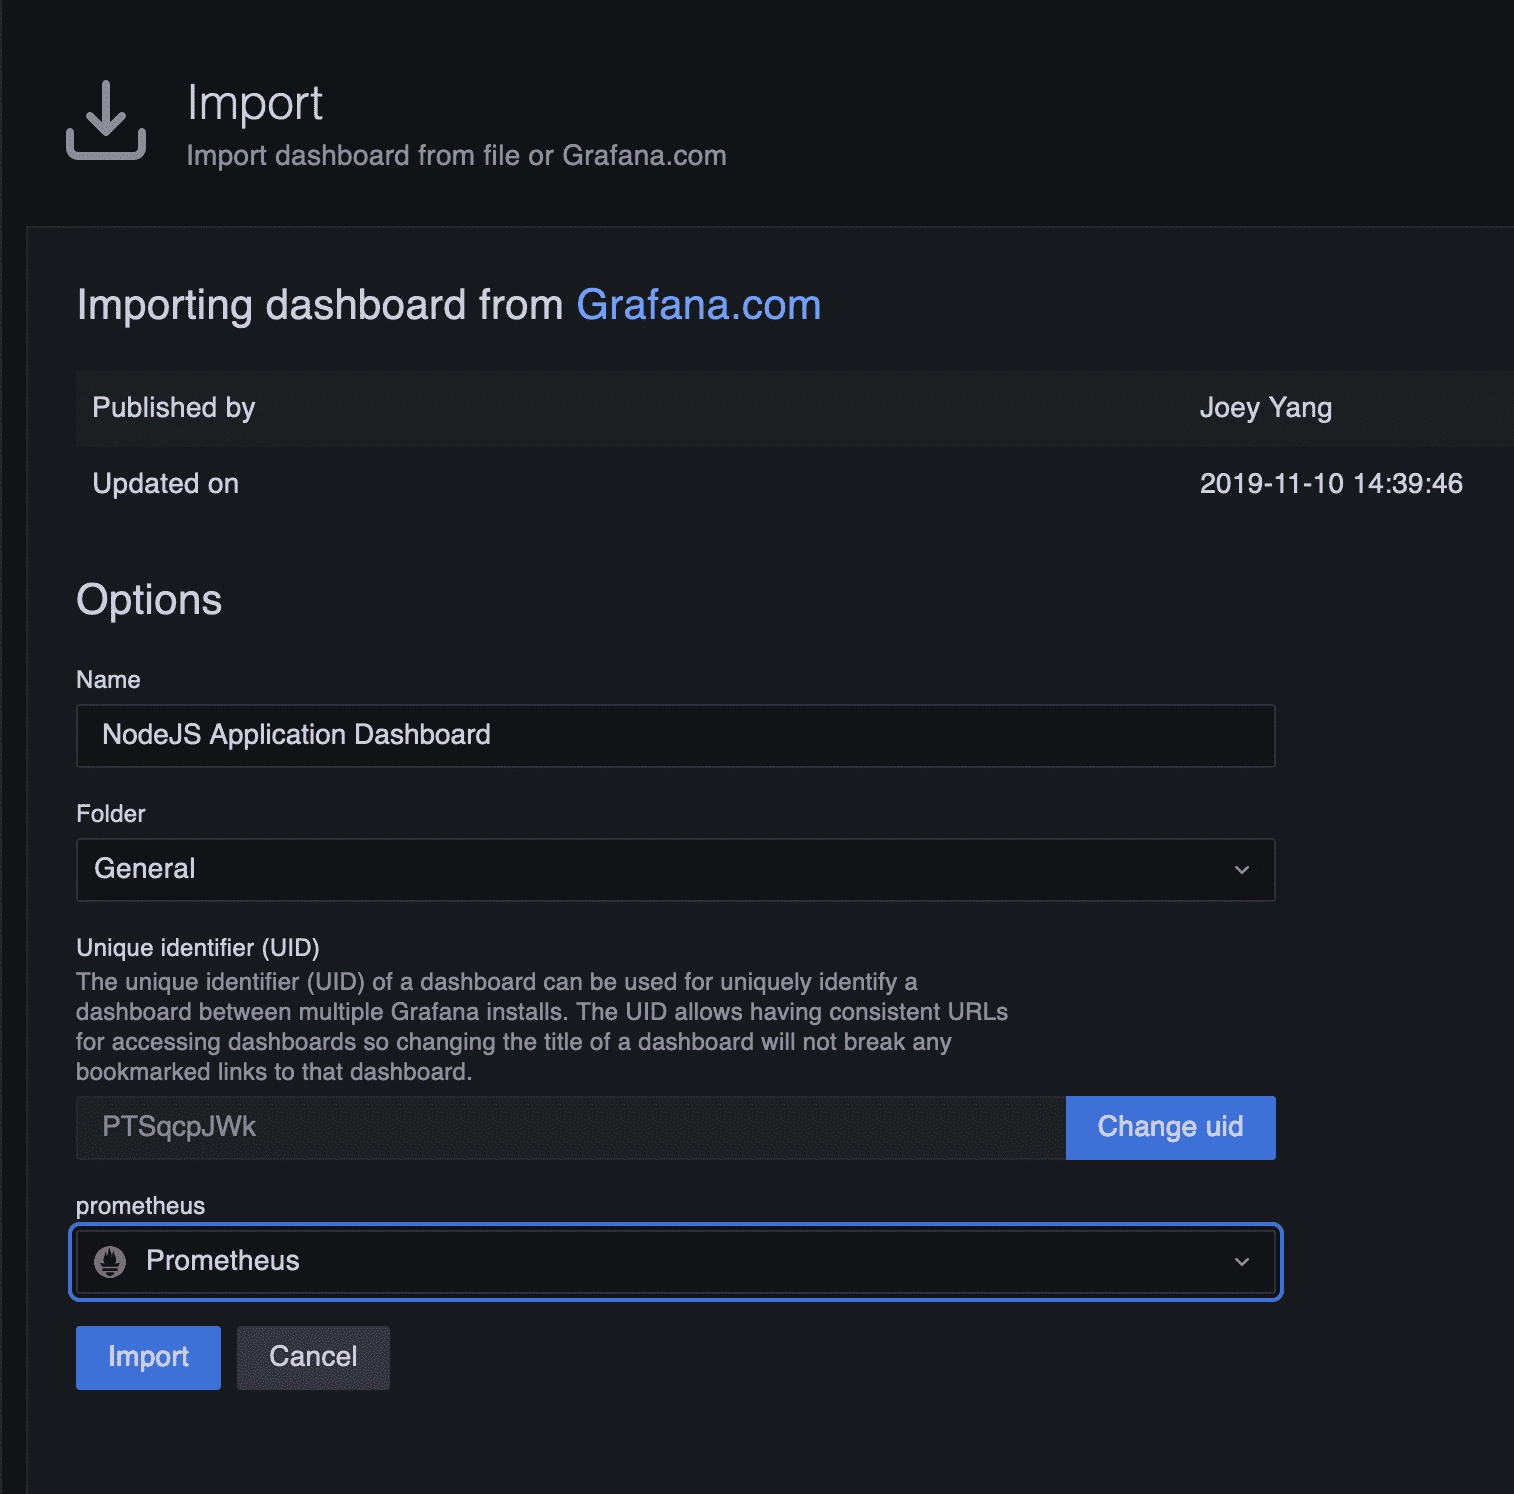
⚠️ Do not forget to select the prometheus source
After the import, you should have a new dashboard called “NodeJS Application Dashboard” that look like this :
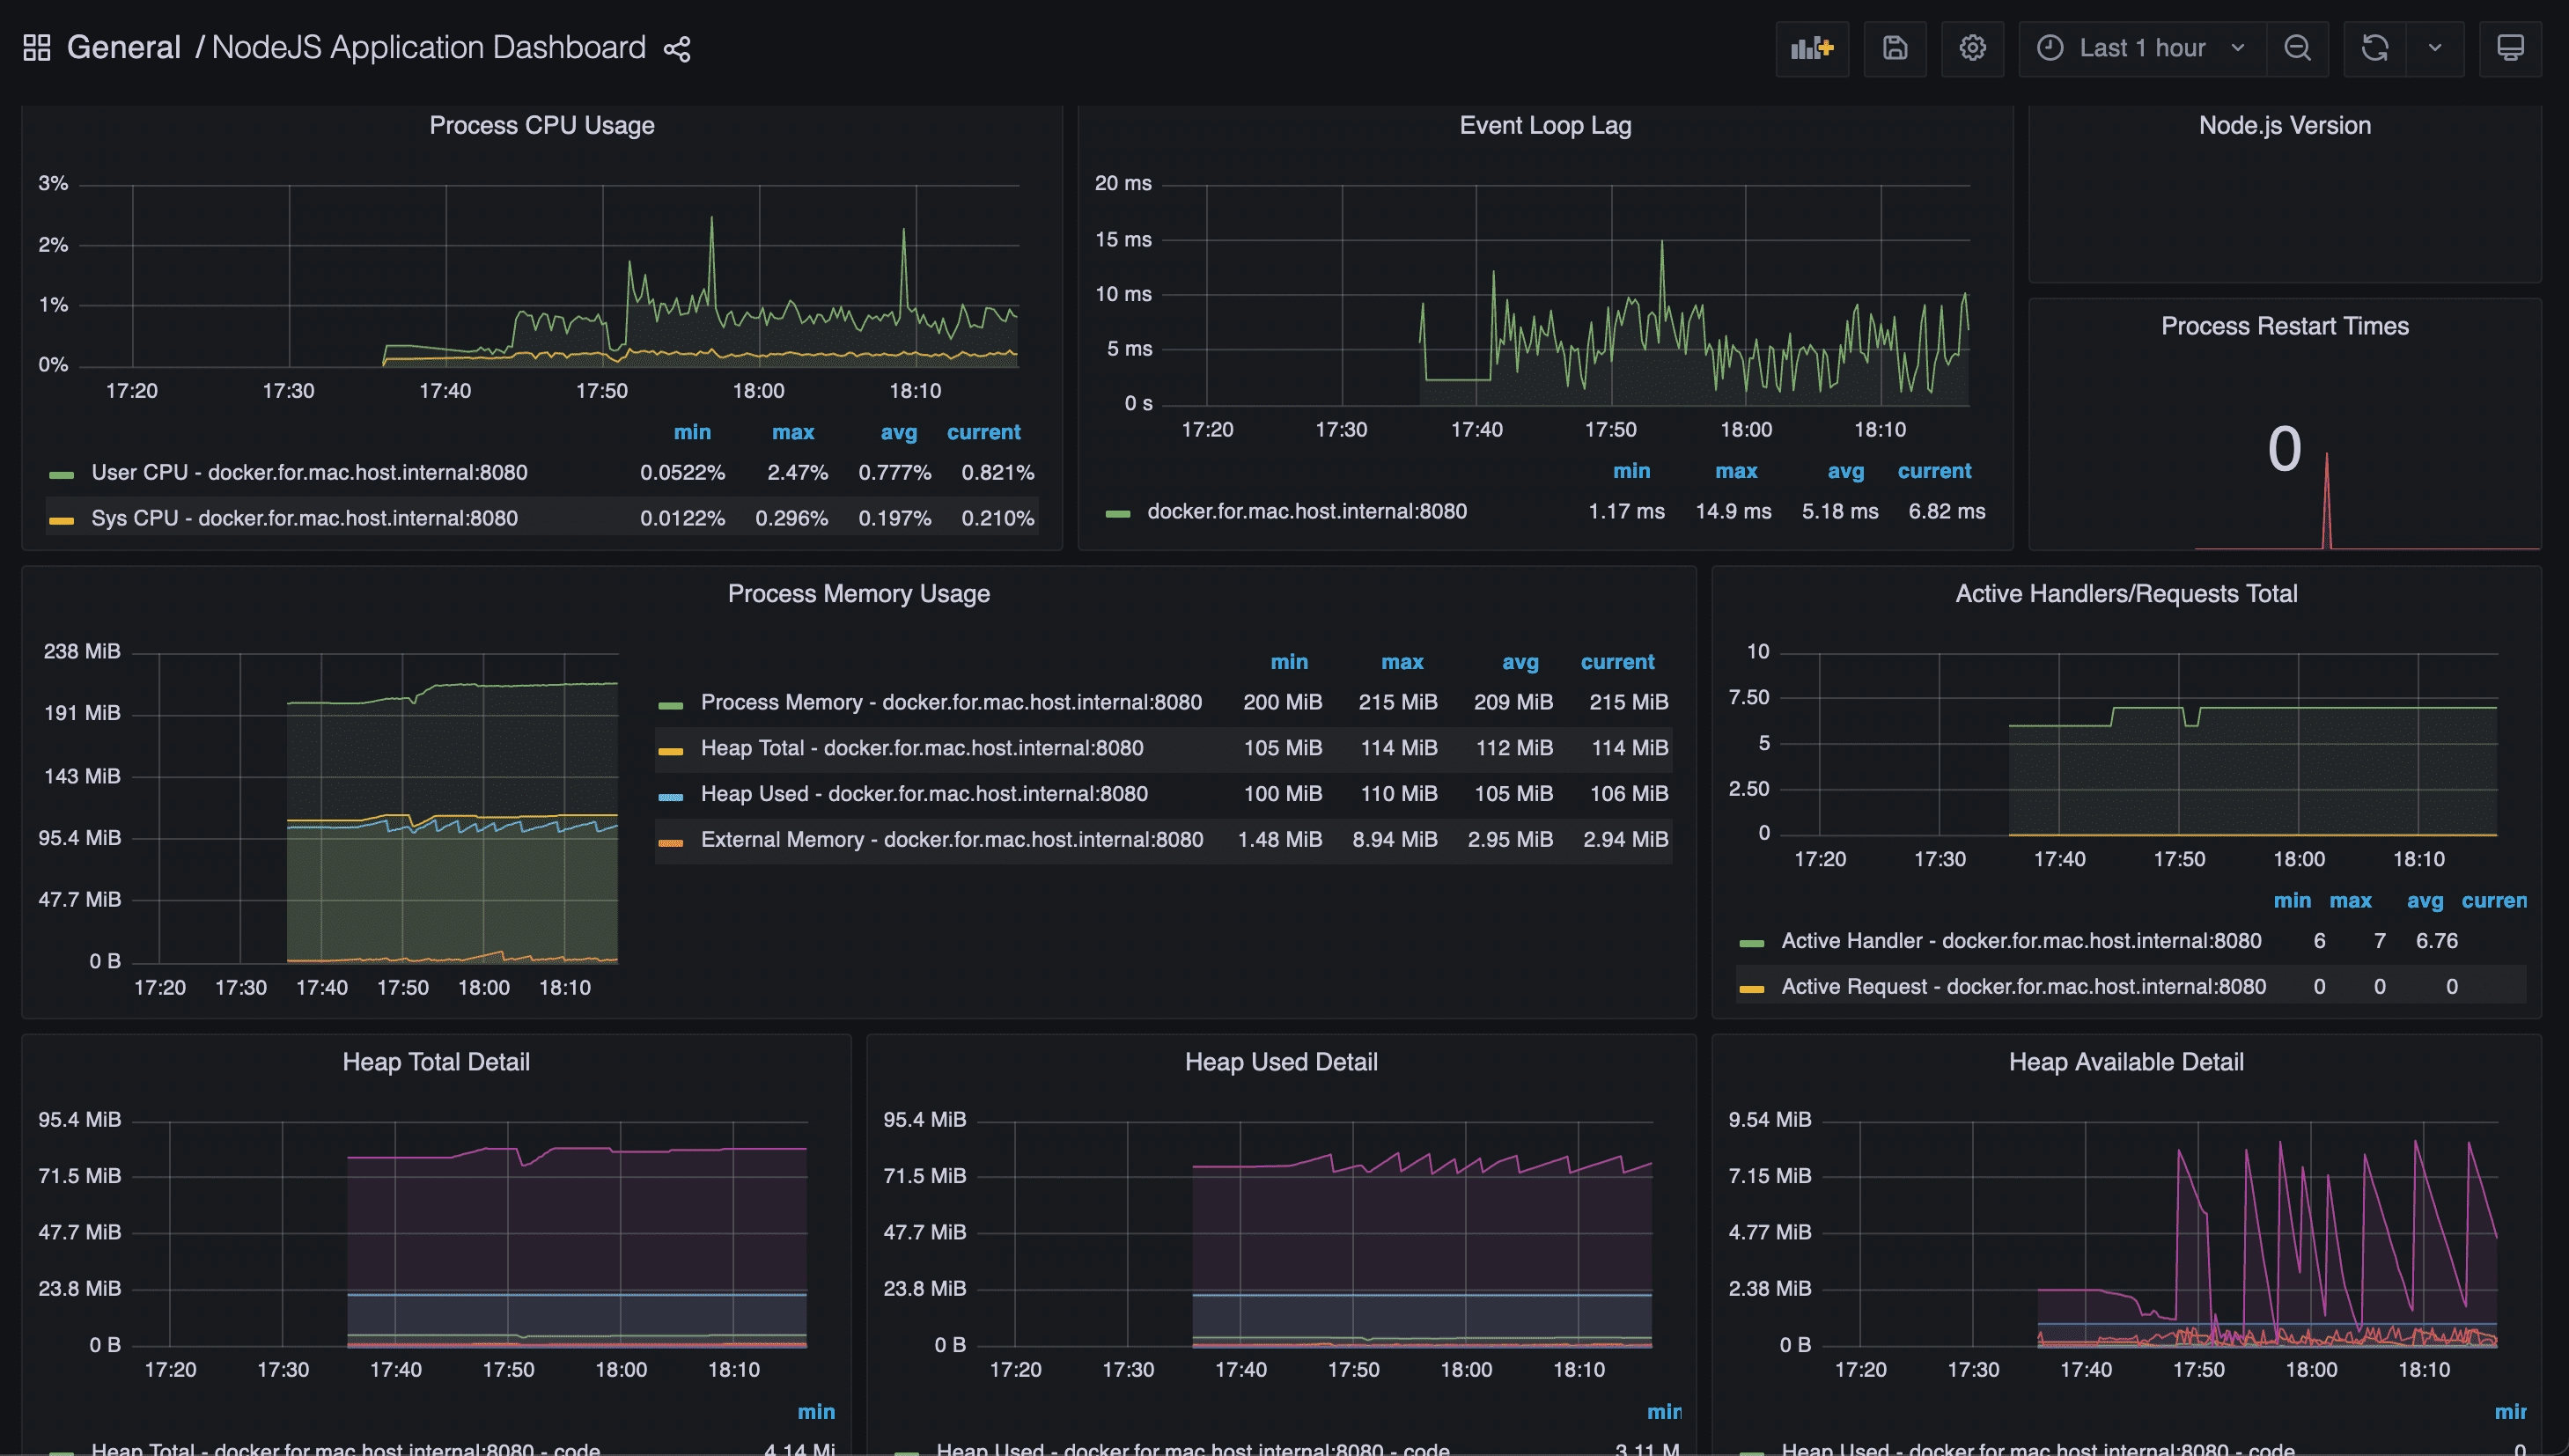
This dashboard will provide you with important information such as:
- CPU consumption
- memory consumption
- event-loop lag (very useful for detecting latency on Node.JS applications)
Final project
You can retrieve and fork the complete project from here : https://gitlab.com/ziggornif/monitoring-article
Do not hesitate to use the API dashboard if you need it : https://gitlab.com/ziggornif/monitoring-article/-/blob/main/monitoring/dashboards/api.json
Bonus #2 - other languages versions
- Go : https://gitlab.com/ziggornif/go-api-monitoring
- Java (Quarkus) : https://gitlab.com/ziggornif/java-api-monitoring
Useful links
https://blog.risingstack.com/node-js-performance-monitoring-with-prometheus/